Verify AI Chart Summaries After 147 EHR Reviews for Clinicians
· 14 min read

Verify AI Chart Summaries After 147 EHR Reviews for Clinicians
AI chart summarization compresses a patient’s longitudinal EHR record into a dated, problem-oriented summary, saving clinicians the grind of scrolling through years of notes. It works as a review aid, not a diagnostic authority: a prospective EHR-integrated evaluation found real gains in speed alongside real omissions. Treat every summary as a draft that Medscrub or any comparable tool hands you for verification, never as a finished clinical judgment.
TL;DR:
- AI chart summaries are prone to omissions, hallucinations, and truncations, so they require careful verification against source notes before clinical use.
- Validation should include external testing, failure analysis, bias assessment, and specialty-specific performance data to ensure safety and accuracy.
- Narrowing the scope to specific encounters or problems and verifying high-risk facts with source citations significantly reduces error risks.
- Implementing on-device processing and strict audit logs enhances patient privacy and governance, aligning with regulatory and ethical standards.
- Regular logging of corrections during pilot phases builds a data-driven understanding of each tool’s limitations and guides safe wider deployment.
Table of Contents
- How AI Chart Summarization Works in Clinical Practice
- What the Evidence Says: Accuracy, Common Errors, and Evaluation Gaps
- Practical Workflow and Verification: A Clinician-Ready Process
- Prompt and Output Schemas That Reduce Hallucination Risk
- Safety, Privacy, and Governance Controls to Require Before Deployment
- Implementation Checklist and Pilot Metrics That Gate Rollout
- MedScrub in Practice: A Privacy-First, On-Device Example
- Author Perspective: Cautious Optimism, Not Blind Trust
- Get Started With Medscrub
- Sources
- FAQ
How AI Chart Summarization Works in Clinical Practice
Chart summarization tools don’t read a chart the way you do. They ingest structured data (labs, vitals, medication lists) and unstructured text (progress notes, discharge summaries, imaging reports, sometimes scanned PDFs from outside health information exchanges) and then decide what to keep and what to leave out.
That decision process runs through several stages:
- Retrieval and selection pulls relevant records from the EHR and any connected external sources, filtering by date range or clinical problem.
- Normalization reconciles inconsistent terminology, units, and formatting across different note authors and systems.
- Concept extraction identifies problems, medications, allergies, and lab values as discrete data points rather than buried prose.
- Temporal ordering arranges those data points chronologically so a clinician can see how a problem evolved.
- Summarization generates the final text, either extractive (pulling verbatim phrases) or abstractive (rewriting in condensed language).
- Provenance linking attaches each claim back to its source note and date.
The model architecture behind this matters more than most vendors admit. Large language models paired with retrieval-augmented methods can pull the most relevant snippets from a huge record before summarizing, but they still operate inside a context window, a hard limit on how much text the model can consider at once. When a chart exceeds that limit, something gets dropped. That’s not a hypothetical risk. It’s a documented failure mode, and it’s why scope matters as much as model choice.
A well-built output gives you a problem-oriented list with dated evidence attached to each entry, a medication reconciliation that flags what’s active versus discontinued, a section on unresolved plans (referrals never completed, follow-up labs never drawn), and clickable provenance so you can jump straight to the source note. If a tool can’t show you where a claim came from, that’s a red flag before it’s a feature.
What the Evidence Says: Accuracy, Common Errors, and Evaluation Gaps
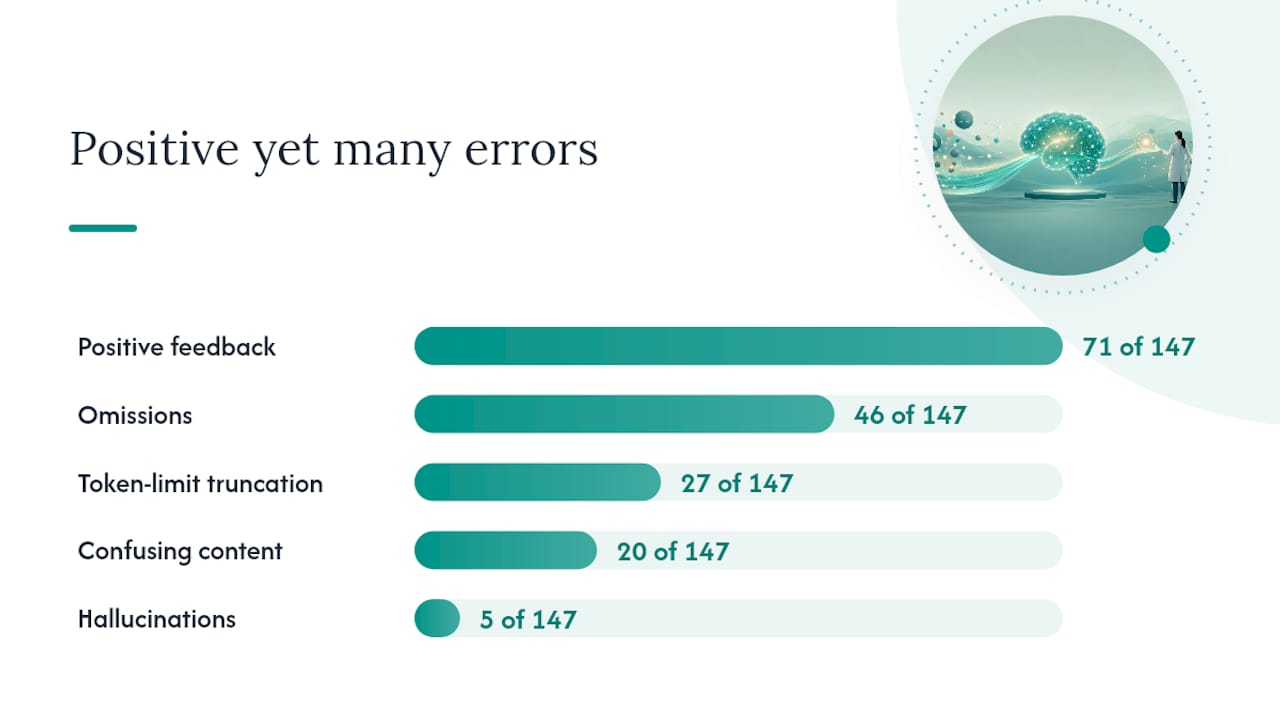
The strongest data point available comes from a prospective evaluation of a GPT-4 note-summarization tool integrated directly into a live EHR. Clinicians reviewed 147 summaries. Seventy-one drew positive feedback. But the same evaluation logged omissions in 46 cases, token-limit truncation in 27, confusing content in 20, and outright hallucinations in 5.
By the numbers: Among clinician-reviewed AI chart summaries in the evaluation, many received positive feedback, though a substantial number exhibited omissions, token-limit truncations, confusing content, and hallucinations, per the npj Health Systems evaluation.
Positive overall ratings and completeness problems coexisted in the same dataset. A clinician can rate a summary “helpful” while it’s still missing a medication change from three weeks ago. That gap between subjective acceptability and objective completeness is the single most important thing to understand before you trust any output.
Zoom out to the broader literature and the picture gets thinner. A scoping review of 30 clinical-text-summarization studies found that while 93% used real patient data, only 7% performed external validation, just 20% reported failure analysis, and a mere 3% analyzed patient-safety risk. None reported a formal bias assessment. Most of the research clusters around radiology reports and ICU data, which means a tool validated for reading chest imaging reports has little bearing on how it performs summarizing a decade of primary care visits.
Separately, a clinical safety framework built around one summarization setup reported a 1.47% hallucination rate and a 3.45% omission rate. Those numbers are specific to that study’s dataset and workflow. They’re useful as a benchmark for what “good” can look like, not as a guarantee that any given vendor’s product performs the same way. The same framework found that iterative changes to prompts and workflow markedly reduced major omissions in testing, which tells you the technology is fixable, not that it arrives fixed.
Before adopting any tool, ask the vendor to produce:
- External validation performed outside the vendor’s own development data.
- A documented failure analysis with named error categories.
- A patient-safety risk assessment specific to your specialty.
- Evidence of bias analysis across patient demographics.
- Specialty-stratified performance results, not a single blended accuracy figure.
Practical Workflow and Verification: A Clinician-Ready Process
Adopting AI chart summarization safely comes down to four steps, and skipping any one of them is where things go wrong.
- Decide scope first. Don’t ask the tool to summarize “the whole chart.” Choose a specific encounter, a single problem, or a bounded time window. Narrower scope means less material competing for space inside the model’s context window, which directly reduces the omission risk documented in the EHR-integrated evaluation.
- Summarize in stages. Extract per-encounter data first, synthesize by problem second, then generate the final dated summary last. This staged approach gives you visibility into what got excluded at each step rather than one opaque final output.
- Run a verification checklist before you rely on anything. Check medications and allergies against the active list, confirm every date lines up with the source note, flag conflicting lab values, and confirm unresolved plans actually got carried forward. For any high-risk fact, pull the quoted source passage rather than taking the summary’s word for it.
- Document sign-off and log corrections. Record who verified the summary, log every correction and near miss, and set a clear threshold for when a chart gets escalated to full manual review instead of AI-assisted review.
Pro Tip: Keep a running log of every correction you make to an AI summary for the first 90 days of use. That log is what turns a vague sense of “it’s pretty good” into real data on where the tool systematically fails, and it’s the fastest way to tell your IT team exactly what to fix.
Prompt and Output Schemas That Reduce Hallucination Risk
The prompt you write, or the one your vendor’s default template uses, shapes error rates as much as the underlying model does. A prompt that asks for a vague “summary of this patient” invites the model to infer connections it shouldn’t. A prompt that defines exact scope and forbids inference performs differently.
Summarize the last 12 months by active problems. Include dated evidence for each problem, current and stopped medications, abnormal-result trends, and unresolved plans. Explicitly note unknowns. Do not infer. Cite the source note and date for each assertion.
That structure, adapted from guidance in a widely cited review of AI’s role in chart review, forces the model to show its work instead of quietly filling gaps.
A useful output schema separates fields by type:
- Dated problem list, each entry tied to the note it came from.
- Current medications versus stopped medications, clearly split.
- Abnormal lab trends with dates, not just the latest value.
- Unresolved plans (pending referrals, incomplete workups).
- Evidence citations for every clinical assertion.
- Confidence flags distinguishing “documented,” “inferred,” and “not found.”
Extractive fields like medication lists should pull verbatim from the record rather than being paraphrased. Free narrative summaries have more room for a clinician’s own interpretation, and more room for error, so reserve them for lower-stakes context rather than active decision-making. No summary should populate a chart or influence a plan without clinician edit and explicit approval first.
Safety, Privacy, and Governance Controls to Require Before Deployment
Before any AI chart summarization tool touches real patient data, your organization needs answers on a specific checklist: what data flows where, how long it’s retained, whether the vendor trains its models on your patients’ records, who has access, whether every action gets logged, and what the breach response plan looks like.
WHO guidance on AI and health frames this around six principles: protecting autonomy, prioritizing human well-being and safety, ensuring transparency and explainability, maintaining accountability, promoting equity, and building governance structures before deployment rather than after. Those principles translate into concrete operational checks:
- Human oversight means a clinician signs off before any AI-generated content enters the permanent record.
- Transparency means the tool shows its sources, not just its conclusions.
- Accountability means someone in your organization owns the error-logging process.
- Equity means performance gets tested across different patient populations, not just the dataset the vendor happened to have.
There’s a regulatory wrinkle worth knowing: FDA guidance on clinical decision support software draws a line between tools that simply summarize existing documentation and tools whose outputs function as a specific treatment recommendation. Cross that line and the software may be regulated as a device, which comes with validation and documentation obligations. Ask any vendor directly which side of that line their product falls on and what evidence backs the answer.
On deployment architecture, on-device or on-premises processing keeps PHI off third-party servers entirely, while cloud-based tools depend on vendor contracts and business associate agreements to manage that same risk. Either approach can work. What matters is provenance, auditability, and a summary schema that includes an honest “not found” field instead of silently papering over gaps.
Implementation Checklist and Pilot Metrics That Gate Rollout
Rolling out AI chart summarization safely starts small, on purpose.
- Run it silent first. Generate summaries in draft-only mode, invisible to the workflow, and compare them side by side against what a clinician would have written manually.
- Sample across specialties and document types. A tool tuned for outpatient primary care notes may perform very differently on ICU flowsheets or scanned handwritten records, echoing the specialty concentration gaps flagged in the scoping review.
- Track hard numbers, not impressions. Log omission counts, hallucination counts, time saved per clinician, and reviewer burden (how long verification actually takes) for every pilot summary.
- Set conservative gating thresholds. The safety framework study reported a 1.47% hallucination rate and 3.45% omission rate in one dataset after tuning. Use figures like that as a reference point for what “acceptable” can look like after iteration, not as a target you should expect on day one. Require specialty-specific validation before expanding scope.
- Feed corrections back into the system. Every logged correction should refine the prompts, the retrieval scope, or the staged summarization process, not just get filed away.
Wider rollout should wait until your own pilot data, not the vendor’s marketing deck, shows the omission and hallucination rates you’re willing to live with.
MedScrub in Practice: A Privacy-First, On-Device Example
Some chart summarization tools sync directly with major EMR systems and run PHI de-identification on the clinician’s own device before any AI model sees the data. That order of operations, anonymize first, process second, is the architectural answer to a lot of the privacy questions raised above. These platforms can generate automated summaries, reminders, lab trend tracking, and problem-based views, aiming to give clinicians back time currently lost to documentation.
Two implementation examples illustrate the pattern in practice: the Monarch Health case study describes nightly chart preparation ahead of clinic days, and the eSpiral case study walks through a deployment where PHI never touches a cloud server at all.
If you’re evaluating any chart summarization tool during a trial, ask pointed questions:
- What validation data supports accuracy claims, and does it cover your specialty?
- How long is data retained, and where does de-identification actually happen (device versus server)?
- Are audit logs available for every AI-generated summary and every clinician edit?
- Can the vendor walk you through the anonymization process step by step?
Confirm these capabilities against your organization’s specific requirements before deployment, as with any clinical software.
Author Perspective: Cautious Optimism, Not Blind Trust
The honest read on this technology is that it’s useful precisely because it’s limited. Chart summarization saves time by surfacing likely-relevant facts fast, and the moment you treat that speed as certainty, you’ve misused the tool. The omission and hallucination counts from real deployments aren’t an indictment of the category. They’re a map of exactly where your attention needs to go. Demand validation specific to your site and specialty, run every new tool silently before it touches a live chart, and log every correction you make. That log is worth more than any vendor’s accuracy claim, because it’s the only evidence built entirely from your own patients.
— Clint
Get Started With Medscrub
Every safety concern raised above, PHI exposure, missing provenance, and opaque validation points to a strong architectural choice: process patient data on the clinician’s own machine and show sources. Some tools are designed to sync with Epic, Oracle Health, athenahealth, and eClinicalWorks while performing on-device anonymization before any summary gets generated.
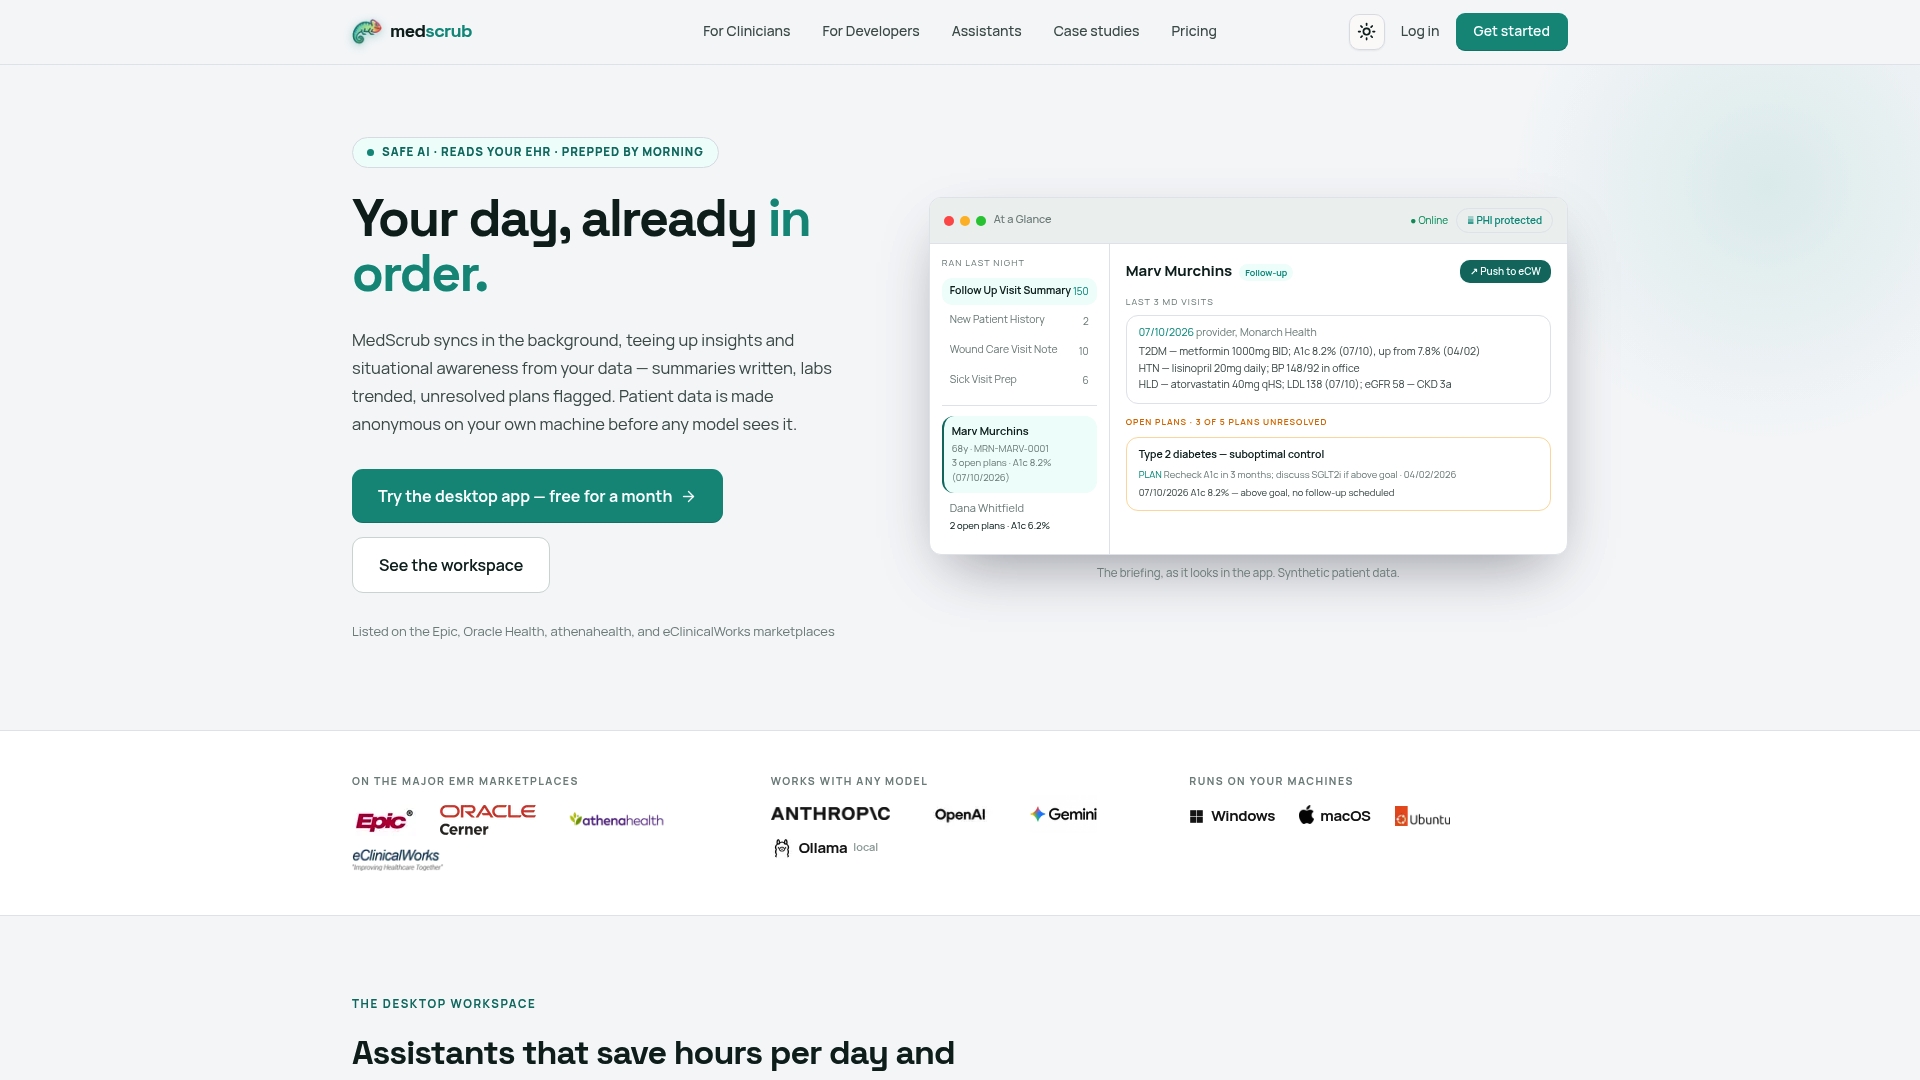
If you want to see how that plays out for a real practice, the Monarch Health and eSpiral case studies cover nightly chart prep and cloud-free PHI handling in detail. Clinicians can review current pricing for the Solo and Practice plans, or reach out about Enterprise options for larger organizations. The physician-focused product page walks through exactly what a clinician sees on day one. Start with a pilot: run it silently on a handful of charts, verify against your own notes, and decide from there whether it earns a place in your daily workflow.
Sources
- Evaluation of electronic health record-integrated artificial intelligence chart review | npj Health Systems
- Scientific Evidence for Clinical Text Summarization Using Large Language Models: Scoping Review - PMC
- A framework to assess clinical safety and hallucination rates of LLMs for medical text summarisation | npj Digital Medicine
- WHO guidance on AI and health (2025)
This article is general information, not a substitute for advice from a qualified doctor. Consult a qualified healthcare professional about your own circumstances before acting on anything here.
FAQ
Which AI Is Best for Chart Summarization?
No single model wins across every specialty and record type. The evidence points toward tools built specifically for clinical text, with retrieval-augmented generation and provenance tracking, outperforming general-purpose chatbots on completeness, per the scoping review of clinical text summarization studies. Medscrub focuses specifically on this use case with on-device PHI handling and EMR integration.
Is ChatGPT a Good Summarizer for Medical Charts?
General-purpose chatbots like ChatGPT can summarize text reasonably well, but they weren’t built with clinical provenance, PHI handling, or EHR integration in mind. A prospective evaluation of a GPT-4 based tool integrated directly into an EHR still found omissions in 46 of 147 reviewed summaries, underscoring why integration and verification workflows matter more than the base model alone.
Is It Legal to Use AI to Summarize Patient Charts?
Using AI to summarize patient charts is legal when it complies with HIPAA and your organization’s data governance policies, including proper PHI handling, access controls, and audit logging. The legal exposure comes from how data is processed and stored, not from the act of summarization itself, which is why on-device de-identification and clear vendor data-use terms matter.
Can I Use Chart Summarization AI for Free?
Free tiers exist for basic summarization tasks, but full EMR-integrated clinical chart summarization typically requires a paid subscription because of the infrastructure, compliance, and integration work involved. Medscrub’s current plans and any nonprofit eligibility details are listed on its pricing page.
How Do I Know If a Chart Summary Missed Something Important?
You verify it manually, every time, against the source chart, focusing on medications, dates, and unresolved plans first since those carry the highest clinical risk. Requesting a summary schema with explicit “not found” fields and source citations, as recommended in guidance on AI-assisted chart review, makes that verification faster and more reliable.